✦ Background & Project Overview
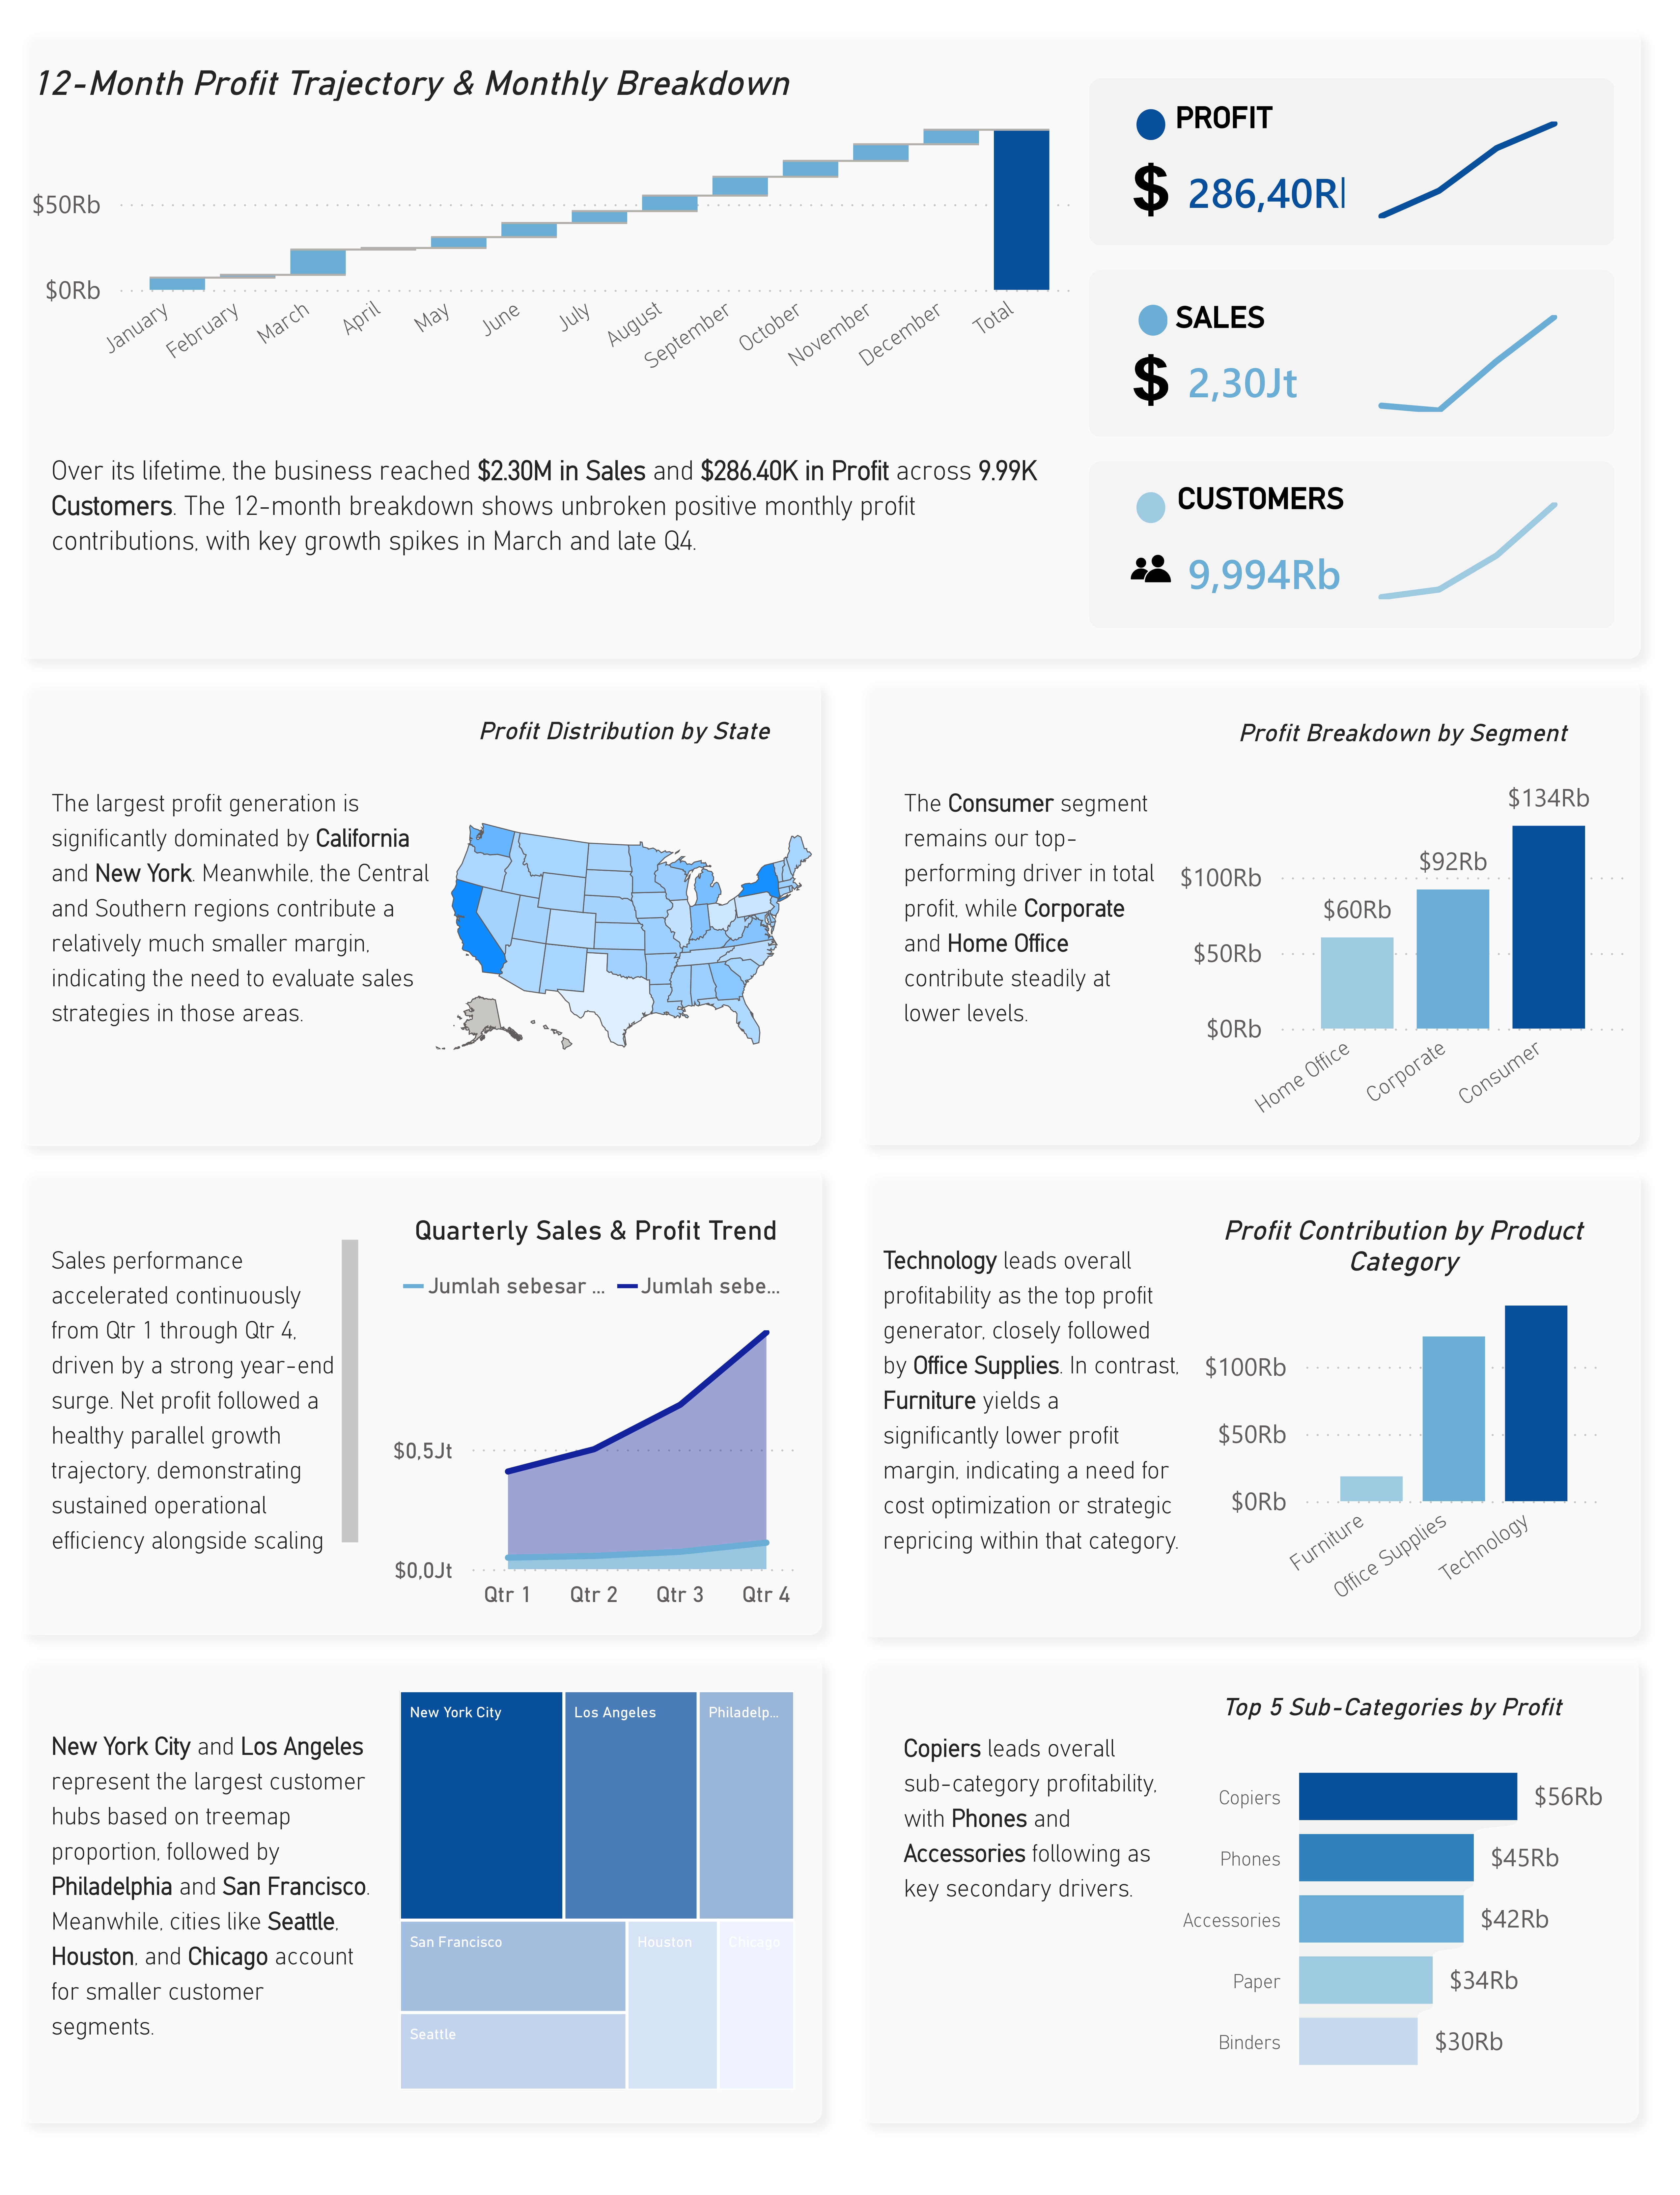
I engineered an interactive Microsoft Power BI dashboard utilizing the widely recognized Superstore Dataset from Kaggle. Through this project, I developed end-to-end data processing workflows using Power Query ETL, formulated custom calculated measures with DAX, and designed intuitive visual reporting to help stakeholders evaluate commercial performance.
This project demonstrates converting raw retail transaction records into strategic business intelligence that supports executive decision-making, cost containment, and profit margin optimization.
✦ Key Business Insights & Findings
Sales Velocity & Profit Margins
Analyzed monthly sales revenue and gross profit margins to identify seasonality patterns and fourth-quarter holiday growth cycles.
Regional Profitability Map
Mapped profit performance across geographic regions and states to identify high-margin clusters versus loss-making territories.
Customer Segment Dynamics
Evaluated revenue and profit contributions across Consumer (50%+ volume), Corporate, and Home Office client tiers.
Category & Return Analysis
Identified top-performing merchandise sub-categories and evaluated product discount impacts on bottom-line profit margins.
✦ Technical Methodology & Engineering
1. Power Query ETL: Ingested raw transactional records, standardized datetime datatypes, resolved missing values, and created an optimized Star Schema dimensional model.
2. DAX Measure Engineering: Formulated calculated measures including Total Sales, Total Profit, Profit Margin %, Total Quantity, and Year-to-Date (YTD) comparisons.
3. Dashboard Storytelling: Designed executive KPI summary cards, time-series line trends, dynamic category rankings, and interactive slicers for seamless cross-filtering.