Background & Project Overview
The global music streaming ecosystem generates billions of listening events daily. For this project, I engineered an end-to-end analytics workflow using the Spotify Artist Streaming Analytics Dataset (2015-2025) from Kaggle. The raw data consisted of over 24 individual monthly transaction files spanning late 2023 through late 2025, each requiring systematic data cleaning, standardization, and schema alignment.
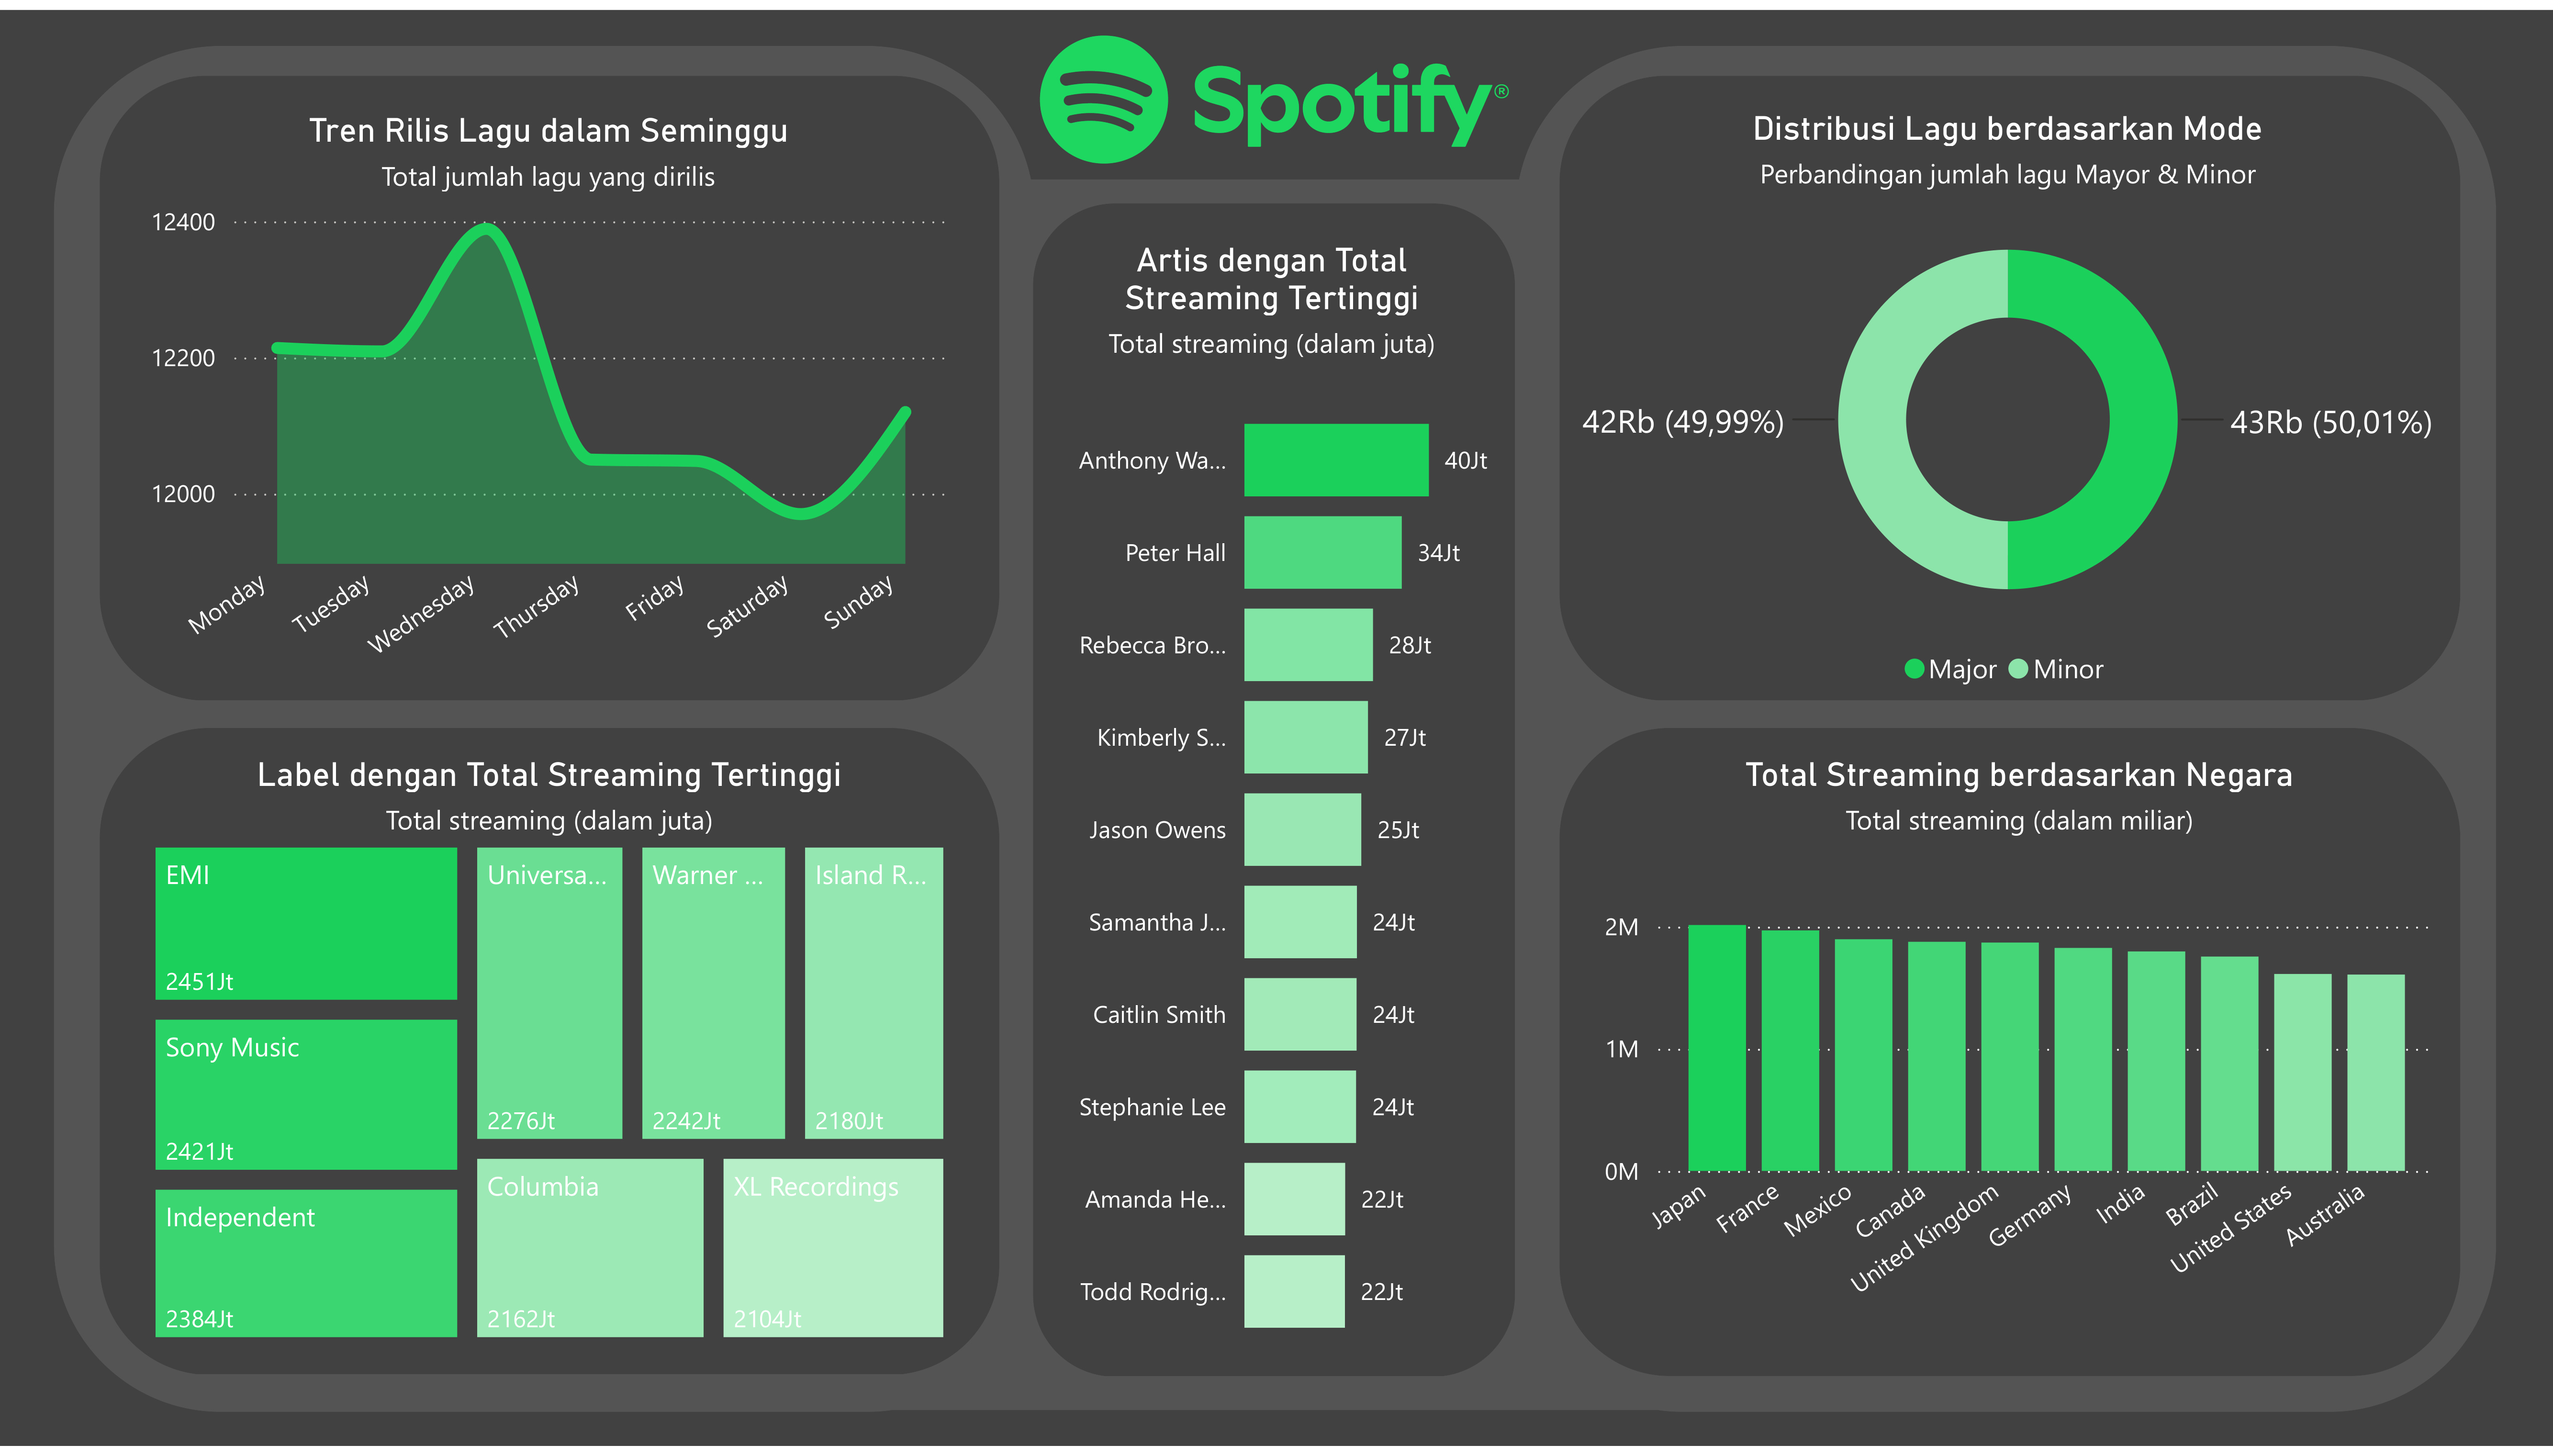
Rather than loading unorganized CSV files directly into visualization tools, I established a robust PostgreSQL 18 relational database via pgAdmin 4. In PostgreSQL, I executed data validation, handled duplicates, built performant aggregation queries, and extracted multi-dimensional metrics. Finally, I connected Power BI directly to PostgreSQL to deliver an executive-grade, dark-themed business intelligence dashboard tailored for music industry stakeholders and artist managers.
Key Business Insights & Analytical Findings
Cross-analyzing streaming counts, release timestamps, genres, and geographic territories revealed crucial commercial insights:
SQL Query Engineering & Data Pipeline Architecture
1. Multi-Batch Data Preparation: Ingested 24+ monthly datasets, standardized datetime headers, validated numeric stream counts, and constructed unified master tables.
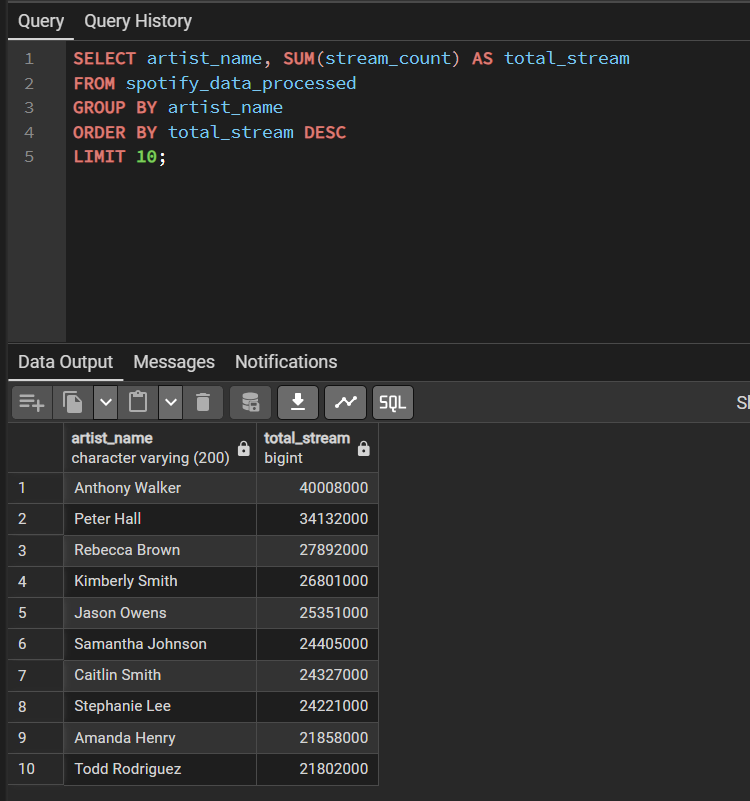
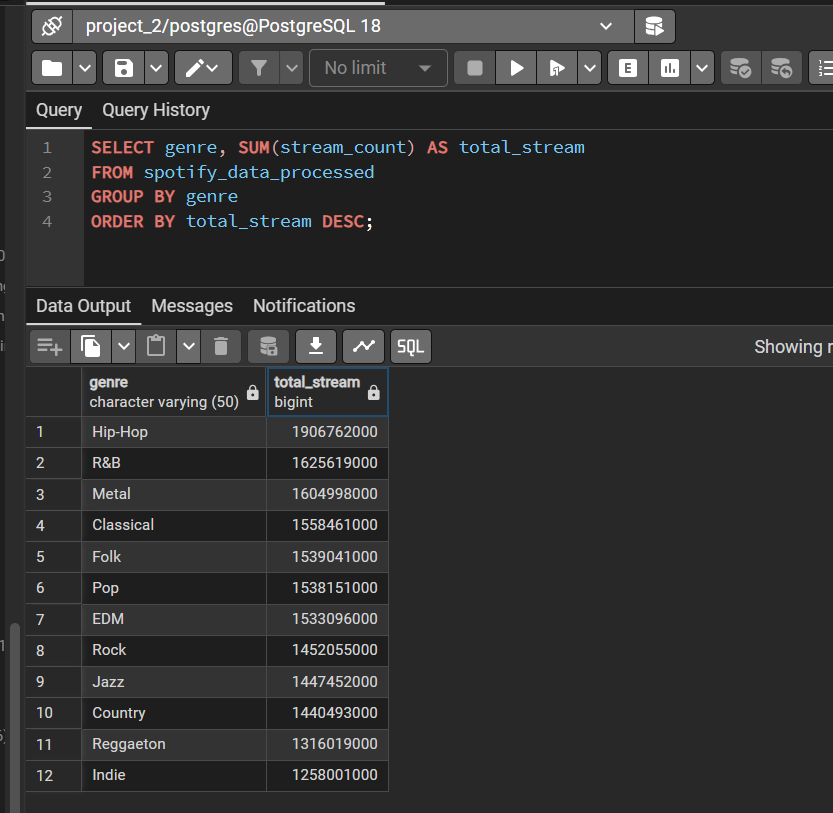
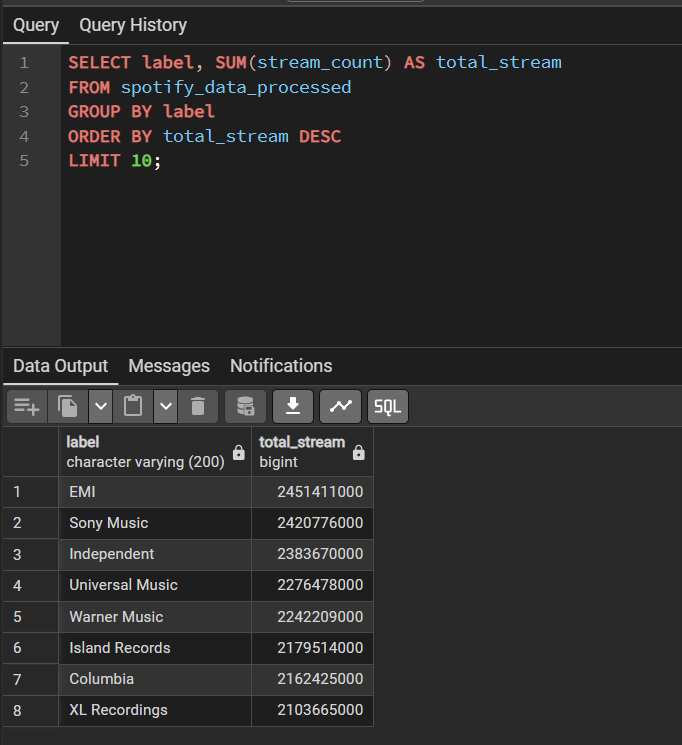
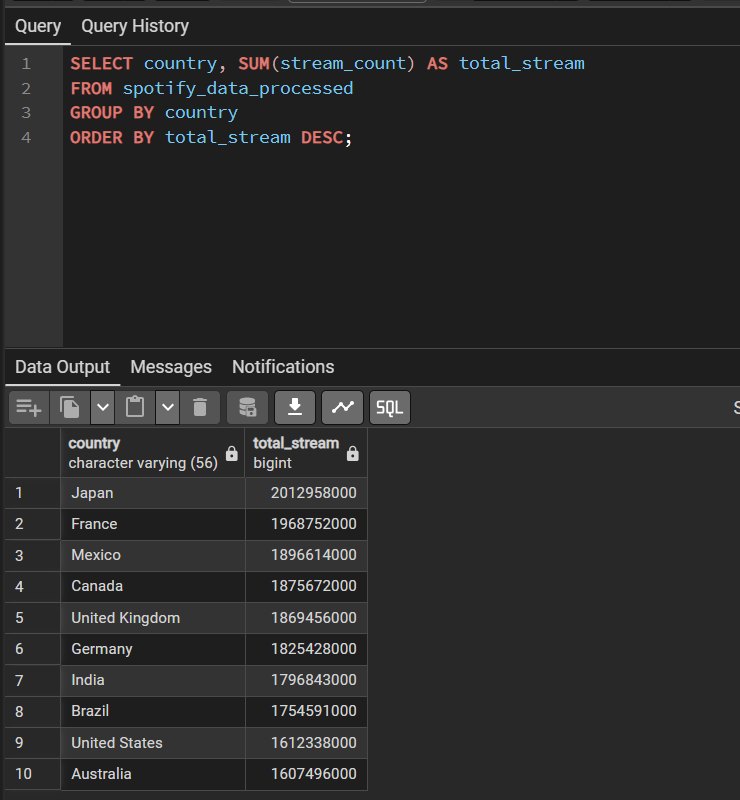
2. PostgreSQL Database Querying & Optimization: Wrote structured SQL queries in PostgreSQL 18 for high-speed grouping, aggregations, and ranking:
3. Power BI Database Connector & Dark Theme Visualization: Loaded PostgreSQL tables directly into Microsoft Power BI, designed custom Spotify brand palettes (#1DB954 green, dark gray canvas), and built interactive cross-filtering visuals.
PostgreSQL Query Execution Gallery
Click on any query screenshot below to view the PostgreSQL 18 / pgAdmin execution outputs: